Exports & Reports
Loggistics can export your data in several formats for sharing with stakeholders, GIS analysts, and buyers. All exports pull live data — every download reflects what is in your account at that moment.
Dashboard Report (PDF)
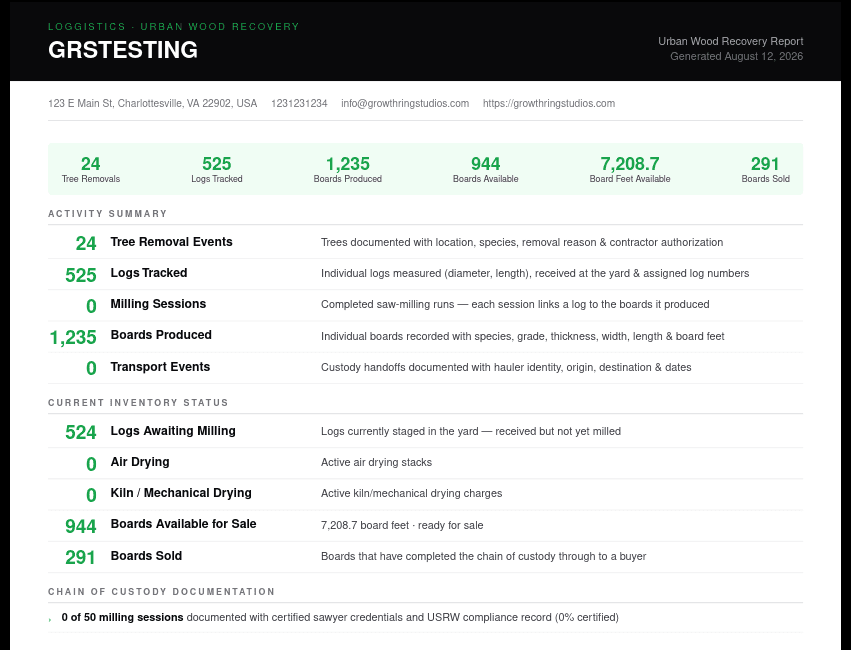
The dashboard report is a single-page PDF summary of your operation designed to be shared with stakeholders who don’t use Loggistics — architects, developers, municipalities, grant committees, or anyone asking “how much wood have you recovered?”
What’s included
- At-a-glance summary bar — tree removals, logs tracked, boards produced, board feet available, and boards sold at a glance
- Activity Summary — each metric with a plain-English description of what it represents
- Current Inventory Status — what is in the yard, drying, available for sale, and sold as of the download date
- Chain of Custody Documentation — percentage of milling sessions, drying charges, and transport events that carry USRW-certified documentation
The report header includes your organization name and any contact details you have set in Settings → Organization.
How to download
- Go to your Dashboard
- Click Download Report in the top-right corner of the page
- The PDF opens or saves immediately — no configuration needed
The Download Report button only appears once your account has at least one record. Nothing to export on an empty account.
Sources GIS CSV
The GIS CSV export produces a comma-separated file of all your source records formatted for direct import into GIS software such as QGIS, ArcGIS Pro, ArcGIS Online, and Google Maps. Each source appears as one row with separate latitude and longitude columns.
Coordinate system
All coordinates are exported in EPSG:4326 — WGS 84 (decimal degrees). This is the standard used by GPS devices, phone photo EXIF data, and Google Maps — it’s what any GPS-capable device actually produces, and the format you can type straight into Google Maps to check a point. A coordinate_system column on every row identifies this explicitly so the file is self-describing.
Your basemap imagery being EPSG:3857 (Web Mercator) doesn’t mean the CSV should be too. Web Mercator is a display projection used by map tile servers (Google/OSM/Mapbox basemaps, ArcGIS Online’s default basemap) to render the world on a flat screen — it’s not a format anyone’s GPS, phone, or field data actually comes in. When you add this CSV as a point layer on top of a Web Mercator basemap, QGIS and ArcGIS both reproject it on the fly automatically, the same way they reproject any two layers with different CRSs. You never need to convert your own data to match a basemap.
Columns
| Column | Description |
|---|---|
source_number | Loggistics source ID (e.g. SRC-004) |
latitude | Decimal degrees, WGS 84 |
longitude | Decimal degrees, WGS 84 |
coordinate_system | Always EPSG:4326 WGS84 |
location_accuracy | How the coordinates were captured (GPS device, photo EXIF, manual, etc.) |
address | Street address as entered |
species | Tree species common name |
dbh_inches | Diameter at breast height in inches |
removal_reason | Why the tree was removed |
removal_date | ISO 8601 date (YYYY-MM-DD) |
contractor_name | Arborist or contractor name |
contractor_type | Contractor classification |
authorization_ref | Permit or authorization reference number |
log_count | Number of logs recovered from this source |
status | Current source status (Planned / Active / Complete) |
backstory | Tree story and provenance notes |
public_url | Public-facing URL for this source record |
record_created | Date the record was created in Loggistics |
Encoding
The file uses UTF-8 with BOM. The byte-order mark ensures ArcGIS, Excel, and QGIS all detect the encoding correctly — without it, special characters in species names and addresses can display as garbled text.
How to download
- Go to Sources
- Click the Export button in the page header
- Select GIS CSV (EPSG:4326)
- The file downloads as
sources-gis-YYYY-MM-DD.csv
The export includes all sources in your account. There is no per-source selection — filter within your GIS software after import.
Importing into QGIS
Open the Data Source Manager
Go to Layer → Add Layer → Add Delimited Text Layer (or press Ctrl+L).
Select the CSV file
Browse to your downloaded file. QGIS should auto-detect the delimiter as comma and the encoding as UTF-8.
Set the geometry fields
Set X field to longitude and Y field to latitude. Set the Geometry CRS to EPSG:4326.
Add the layer
Click Add. Your sources will appear as point features on the map.
Importing into ArcGIS Pro
Use the XY Table to Point tool
In the Geoprocessing pane, search for XY Table to Point.
Configure the tool
Set the input table to your CSV file, X Field to longitude, Y Field to latitude, and the coordinate system to GCS WGS 1984 (EPSG:4326).
Run
Click Run. A new point feature class is created in your project geodatabase.
Species Yield Chart (PNG)
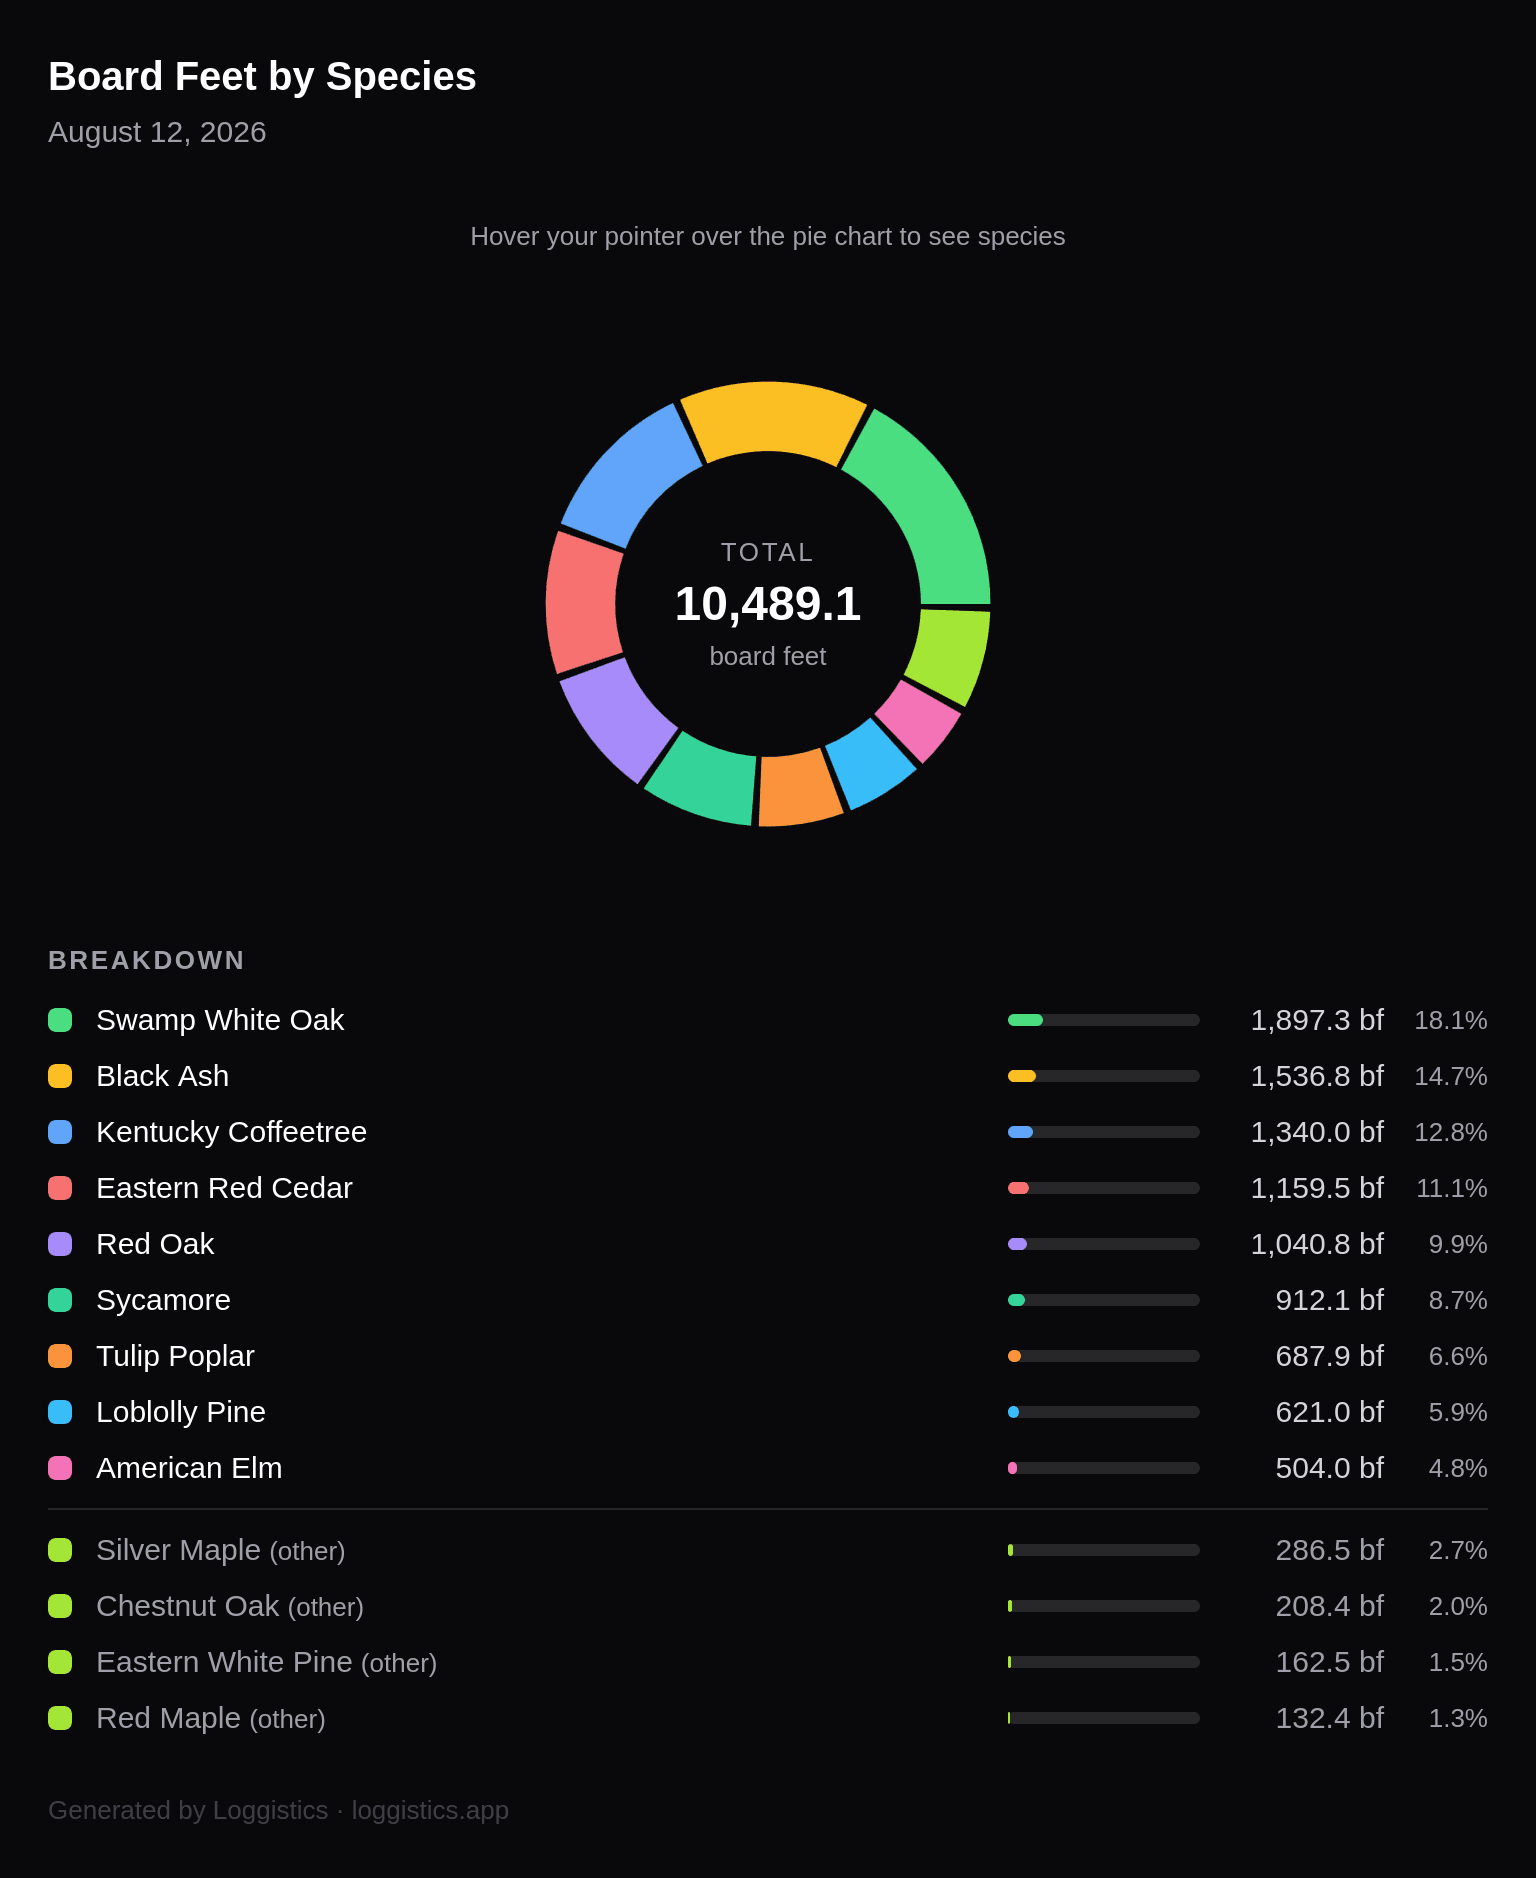
The species yield chart shows how your board feet of lumber breaks down by species across your entire inventory. It is a donut chart with each species as a colored slice, sized by total board feet milled.
What’s included
- Donut chart with one slice per species (species below 3% of total are grouped into an Other slice)
- Center label showing the total board feet across all species
- Full breakdown table listing every species with board feet and percentage — including individual entries for species in the Other group, marked with (other)
- Date generated in the subtitle
- Organization branding in the footer
Hover interaction
Hover your pointer over the pie chart to see species details — each slice shows the species name, board feet, and percentage in a readout above the chart. The readout area never overlaps the chart.
How to download
- Go to Inventory
- Click the Export button in the page header
- Select Species Yield Chart
- The chart page opens showing your current data
- Click Download PNG in the top-right corner
- The file saves as
species-yield-YYYY-MM-DD.pngat 2× resolution (suitable for print and presentations)
The chart only shows species for boards that have board feet recorded. Boards without a board feet measurement are excluded from the totals.